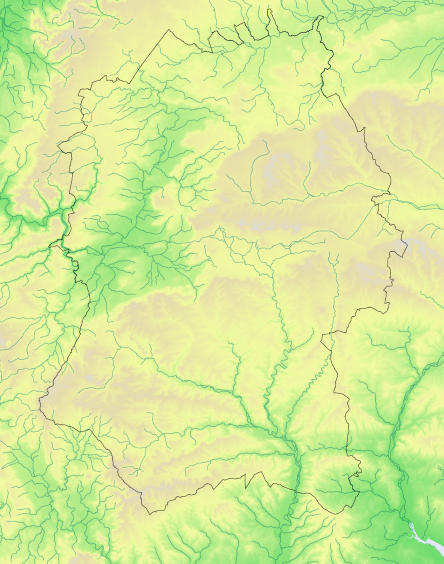
Common Crossbill Loxia curvirostra
Winter abundance 2007–2012
Local and irregular breeder in years after eruptions from Fenno-Scandia
Hide topography
Show rivers
Show woodland
Show urbanisation
Contains Ordnance Survey data © Crown copyright and database right 2013
 - Not recorded")
 - >100% more than average")
 - Average +/- 25%")
 - 25-50% fewer than average")
 - >50% fewer than average")
 - 25-100% more than average")
Atlas species lists
- Breeding distribution 1995–2000
- Summer abundance 1995–2000
- Winter distribution 1995–2000
- Winter abundance 1995–2000
- Breeding distribution 2007–2012
- Summer abundance 2007–2012
- Winter distribution 2007–2012
- Winter abundance 2007–2012
- Breeding distribution change
- Summer abundance change
- Winter distribution change
- Winter abundance change
More Common Crossbill maps
- Breeding distribution 1995–2000
- Summer abundance 1995–2000
- Winter distribution 1995–2000
- Winter abundance 1995–2000
- Breeding distribution 2007–2012
- Summer abundance 2007–2012
- Winter distribution 2007–2012
- Winter abundance 2007–2012
- Breeding distribution change
- Summer abundance change
- Winter distribution change
- Winter abundance change
More maps for this atlas
Map explanation
This map shows the winter relative abundance of the species in Wiltshire, based on variation from the average, as revealed by the shared fieldwork for Bird Atlas 2007-2011 (BTO 2013) and for Wiltshire Tetrad Atlas 2007-2012.
Key
Relative to average
Nos tetrads
>50% fewer
9
1%
25-50% fewer
5
1%
Average +/- 25%
1
<1%
25-100% more
4
<1%
>100% more
3
<1%
Total
22
2%
Crossbills of the nominate race L.c.curvirostra breed from Western Europe, right across Asia to the Sea of Okhotsk while 18 other sub-species are found elsewhere in Europe and Asia, in northwest Africa and North and Central America. There are at least three other Crossbill species, two of which, Parrot Crossbills and Scottish Crossbills, breed in Scotland alongside Common Crossbills.
Crossbills are peculiarly adapted to exploit the seeds of coniferous trees and their presence and numbers in any one country are dependent on the success or failure of the cone crop in that country in relation to the situation in other countries in the breeding range. In Britain some years have been notable for substantial irruptions when the spruce crop has failed in the vast forests of northern Europe. The 1988-91 Breeding Atlas suggested that fewer than 1000 Crossbills may be present in Britain in non-irruption years, but noted that in 1995 - a year when there was a substantial irruption - up to 40,000 were estimated to be present in one forest site in Northumberland alone. Crossbills were particularly numerous in the period covered by the fieldwork for Bird Atlas 2007-11. The range expansions recorded in that atlas (of 331% since 1968-72 for the breeding population of the British Isles and 215% since 1981-84 for the winter population) cannot therefore be taken as necessarily indicative of long term trends.
In Wiltshire, there have been reports of Crossbills at least since the mid-19th century, becoming more frequent following the establishment of new conifer plantations after the 1914-18 War. Nesting was first noted in 1932 and at irregular intervals from then on. Birds of Wiltshire recorded them in 20 tetrads during the breeding season though nesting was confirmed in only one. WTA2, in line with what was happening in Britain as a whole during this period, recorded Crossbills in 60 tetrads with breeding in 14.
References
The following references are used throughout these species accounts, in the abbreviated form given in quotation marks:
“1968-72 Breeding Atlas” – Sharrack, J.T.R. 1976: The Atlas of Breeding Birds in Britain and Ireland. T. & A. Poyser
“1981-84 Winter Atlas” – Lack, P.C. 1986: The Atlas of Wintering Birds in Britain and Ireland. T. & A. Poyser
“1988-91 Breeding Atlas” – Gibbons, D.W., Reid, J.B. & Chapman, R.A. 1993: The New Atlas of Breeding Birds in Britain and Ireland 1988-91. T. & A. Poyser
“Birds of Wiltshire” – Ferguson-Lees, I.J. et al. 2007 : Birds of Wiltshire, published by the tetrad atlas group of the Wiltshire Ornithological Society after mapping fieldwork 1995-2000. Wiltshire Ornithological Society.
“Bird Atlas 2007-2011” – Balmer, D.E., Gillings, S., Caffrey, B.J., Swann, R.L., Downie, I.S. and Fuller, R.J. 2013: Bird Atlas 2007-2011: the Breeding and Wintering Birds of Britain and Ireland
“WTA2” – ("Wiltshire Tetrad Atlas 2 ") the present electronic publication, bringing together the Wiltshire data from “Birds of Wiltshire” and “Bird Atlas 2007-11”, together with data from further fieldwork carried out in 2011 and 2012.
"Hobby" - the annual bird report of the Wiltshire Ornithological Society.