Atlas species lists
- Breeding distribution 1995–2000
- Summer abundance 1995–2000
- Winter distribution 1995–2000
- Winter abundance 1995–2000
- Breeding distribution 2007–2012
- Summer abundance 2007–2012
- Winter distribution 2007–2012
- Winter abundance 2007–2012
- Breeding distribution change
- Summer abundance change
- Winter distribution change
- Winter abundance change
More Great White Egret maps
- Breeding distribution 1995–2000
- Summer abundance 1995–2000
- Winter distribution 1995–2000
- Winter abundance 1995–2000
- Breeding distribution 2007–2012
- Summer abundance 2007–2012
- Winter distribution 2007–2012
- Winter abundance 2007–2012
- Breeding distribution change
- Summer abundance change
- Winter distribution change
- Winter abundance change
More maps for this atlas
Map explanation
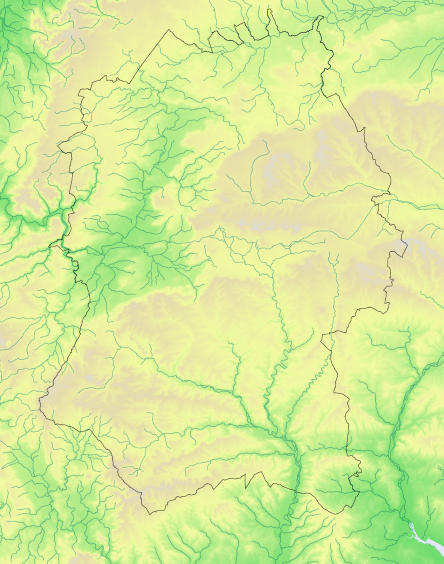
This map shows the changes which occurred in the winter relative abundance of the species between 1995-2000 and 2007-2012, but only in the limited selection of tetrads that were surveyed in winter for Birds of Wiltshire (Wiltshire Ornithological Society 2007).
Key
Relative to average
Nos tetrads

More abundant
0
0%

Equally abundant
0
0%

Less abundant
0
0%

Not surveyed in both periods

