Atlas species lists
- Breeding distribution 1995–2000
- Summer abundance 1995–2000
- Winter distribution 1995–2000
- Winter abundance 1995–2000
- Breeding distribution 2007–2012
- Summer abundance 2007–2012
- Winter distribution 2007–2012
- Winter abundance 2007–2012
- Breeding distribution change
- Summer abundance change
- Winter distribution change
- Winter abundance change
More Common Redpoll maps
- Breeding distribution 1995–2000
- Summer abundance 1995–2000
- Winter distribution 1995–2000
- Winter abundance 1995–2000
- Breeding distribution 2007–2012
- Summer abundance 2007–2012
- Winter distribution 2007–2012
- Winter abundance 2007–2012
- Breeding distribution change
- Summer abundance change
- Winter distribution change
- Winter abundance change
More maps for this atlas
Map explanation
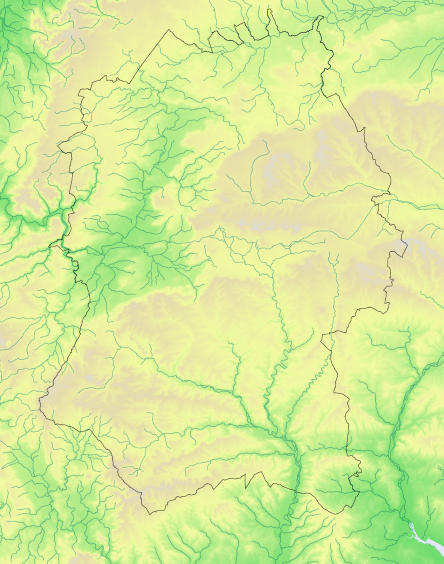
This map shows the winter relative abundance of the species in Wiltshire, based on variation from the average, as revealed by the fieldwork for Birds of Wiltshire (Wiltshire Ornithological Society 2007).
Key
Relative to average
Nos tetrads

>50% fewer
0
0%

25-50% fewer
0
0%

Average +/- 25%
0
0%

25-100% more
0
0%

>100% more
0
0%
Total
0
0%

Not surveyed

