Mute Swan Cygnus olor
Winter distribution change
Widespread and increasing resident, mainly from long-established feral stock
Atlas species lists
- Breeding distribution 1995–2000
- Summer abundance 1995–2000
- Winter distribution 1995–2000
- Winter abundance 1995–2000
- Breeding distribution 2007–2012
- Summer abundance 2007–2012
- Winter distribution 2007–2012
- Winter abundance 2007–2012
- Breeding distribution change
- Summer abundance change
- Winter distribution change
- Winter abundance change
More Mute Swan maps
- Breeding distribution 1995–2000
- Summer abundance 1995–2000
- Winter distribution 1995–2000
- Winter abundance 1995–2000
- Breeding distribution 2007–2012
- Summer abundance 2007–2012
- Winter distribution 2007–2012
- Winter abundance 2007–2012
- Breeding distribution change
- Summer abundance change
- Winter distribution change
- Winter abundance change
Map explanation
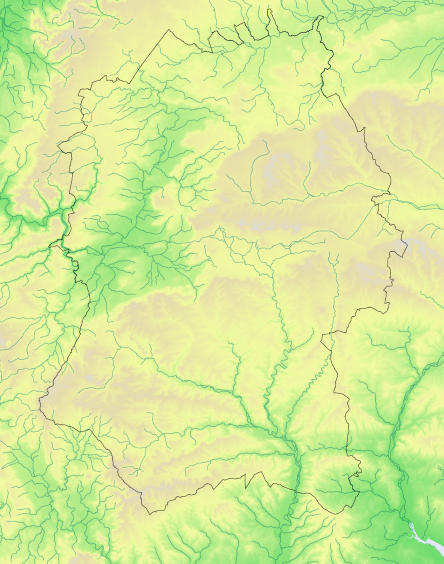
This map shows the changes which occurred in the winter distribution of the species between 1995-2000 and 2007-2012, but only in the limited selection of tetrads that were surveyed in winter for Birds of Wiltshire (Wiltshire Ornithological Society 2007).
Key
Status
Nos tetrads

Absent to present
52
12%

Present in both
64
14%

Present to absent
14
3%

Not surveyed
Although originally existing in a wild state, today’s Mute Swan population in Britain derives almost entirely from semi-domesticated flocks kept mainly for food up until the early 18th century. In Wiltshire, they breed along all the main rivers and canals and on lakes and ponds such as those in and around Swindon and at the Cotswold Water Park (CWP).
Bird Atlas 2007-11 showed a 9% increase since the first national atlas of 1968-72 in the number of 10km squares on the UK mainland where Mute Swans were present in the breeding season, with most of the increase occurring in Wales, northern England and Scotland. In Wiltshire there has been little change over that period, though in the decade since the fieldwork was done for Birds of Wiltshire the number of tetrads occupied in the breeding season in the county increased from 193 to 200. Within that total the number of tetrads where breeding was probable or confirmed increased by 16%, from 124 to 144. Most notably, the area around Swindon saw an 86% increase in the number of tetrads where breeding occurred, and there were modest increases also at the CWP, along the Bristol Avon and along the tributaries of the Salisbury Avon, although on the main river there was a slight decrease.
The breeding season relative abundance change map in Bird Atlas 2007-11 showed only slight changes in Wiltshire: there was a marginal increase in abundance in the area around the CWP and a marginal decrease in the area between Chippenham and Marlborough; otherwise, no change.
Average peak winter counts at the CWP increased from 81 in 1997-2000 to 140 in 2007-2011. Statistics from other sites are patchy but appear to indicate little change.
References
The following references are used throughout these species accounts, in the abbreviated form given in quotation marks:
“1968-72 Breeding Atlas” – Sharrack, J.T.R. 1976: The Atlas of Breeding Birds in Britain and Ireland. T. & A. Poyser
“1981-84 Winter Atlas” – Lack, P.C. 1986: The Atlas of Wintering Birds in Britain and Ireland. T. & A. Poyser
“1988-91 Breeding Atlas” – Gibbons, D.W., Reid, J.B. & Chapman, R.A. 1993: The New Atlas of Breeding Birds in Britain and Ireland 1988-91. T. & A. Poyser
“Birds of Wiltshire” – Ferguson-Lees, I.J. et al. 2007 : Birds of Wiltshire, published by the tetrad atlas group of the Wiltshire Ornithological Society after mapping fieldwork 1995-2000. Wiltshire Ornithological Society.
“Bird Atlas 2007-2011” – Balmer, D.E., Gillings, S., Caffrey, B.J., Swann, R.L., Downie, I.S. and Fuller, R.J. 2013: Bird Atlas 2007-2011: the Breeding and Wintering Birds of Britain and Ireland
“WTA2” – the present electronic publication, bringing together the Wiltshire data from “Birds of Wiltshire” and “Bird Atlas 2007-11”, together with data from further fieldwork carried out in 2011 and 2012.

