Atlas species lists
- Breeding distribution 1995–2000
- Summer abundance 1995–2000
- Winter distribution 1995–2000
- Winter abundance 1995–2000
- Breeding distribution 2007–2012
- Summer abundance 2007–2012
- Winter distribution 2007–2012
- Winter abundance 2007–2012
- Breeding distribution change
- Summer abundance change
- Winter distribution change
- Winter abundance change
Map explanation
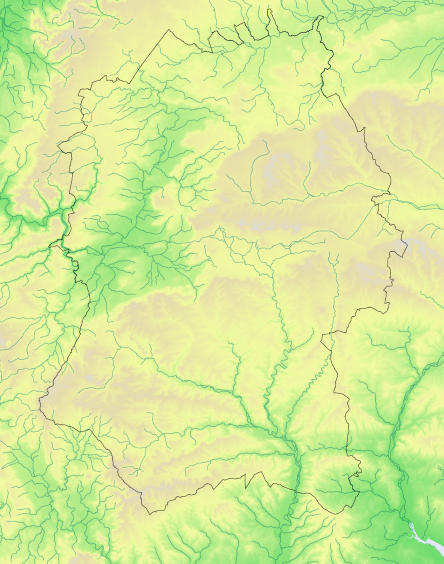
This map illustrates the relative species richness of every tetrad in Wiltshire based on the number of species recorded in that tetrad during the breeding season shared fieldwork for Bird Atlas 2007-2011 (BTO 2013) and for Wiltshire Tetrad Atlas 2007-2012.
Summary results
Between -1 and 88 species were recorded in each surveyed tetrad, with an average of 26.
Key
Species count
Tetrads

1 - 30
654
71%

31 - 45
205
22%

46 - 60
39
4%

61 - 75
12
1%

76 or more
2
<1%

Not surveyed
3
<1%
