Marsh Harrier Circus aeruginosus
Summer abundance change
Migrant, has summered, breeds Europe (local Britain), winters Mediterranean/Africa
Hide topography
Show rivers
Show woodland
Show urbanisation
Contains Ordnance Survey data © Crown copyright and database right 2013
 - Absent in both")
 - More abundant")
")
Atlas species lists
- Breeding distribution 1995–2000
- Summer abundance 1995–2000
- Winter distribution 1995–2000
- Winter abundance 1995–2000
- Breeding distribution 2007–2012
- Summer abundance 2007–2012
- Winter distribution 2007–2012
- Winter abundance 2007–2012
- Breeding distribution change
- Summer abundance change
- Winter distribution change
- Winter abundance change
More Marsh Harrier maps
- Breeding distribution 1995–2000
- Summer abundance 1995–2000
- Winter distribution 1995–2000
- Winter abundance 1995–2000
- Breeding distribution 2007–2012
- Summer abundance 2007–2012
- Winter distribution 2007–2012
- Winter abundance 2007–2012
- Breeding distribution change
- Summer abundance change
- Winter distribution change
- Winter abundance change
More maps for this atlas
Map explanation
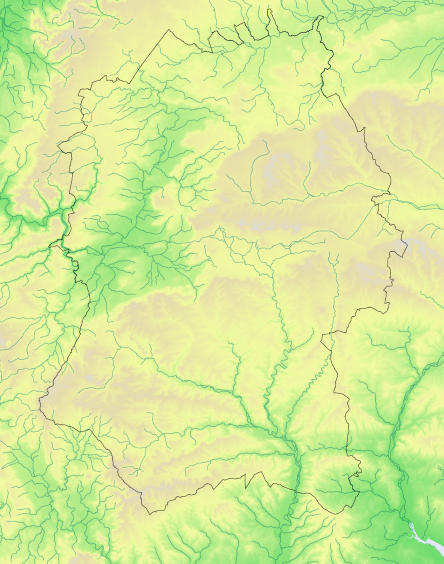
This map shows where changes occurred in the relative abundance of the species in Wiltshire between 1995-2000 and 2007-2012, as revealed by the fieldwork for Birds of Wiltshire (Wiltshire Ornithological Society 2007) and the shared fieldwork for Bird Atlas 2007-2011 (BTO 2013) and for Wiltshire Tetrad Atlas 2007-2012.
Key
Relative to average
Nos tetrads
More abundant
2
<1%

Equally abundant
0
0%

Less abundant
0
0%
Not surveyed in both periods
Marsh Harriers breed right across Eurasia, from Iberia to the Pacific; in Europe they nest in most countries from the Mediterranean to the Baltic, and especially in the central plains from eastern France the Netherlands and Germany to Ukraine and south-central Russia. Those from north, central and east Europe migrate in winter to the Mediterranean and Africa, but those from the south and west are more sedentary.
In the 18th and early 19th centuries Marsh Harriers probably bred widely in England and Wales, but drainage of wetlands led to loss of habitats so that by the beginning of the 20th century there were no more than single records, all in Norfolk, in only three years between 1900 and 1926. From 1927 onwards small numbers were recorded annually in Norfolk and, from the 1940s to the early 1950s, in Suffolk and four other counties westward to Anglesey. Numbers declined again in the later 1950s, probably as a result of poisoning from organochlorine pesticides, until only a single pair remained by 1971. The introduction of restrictions on the use of pesticides then led to a remarkable recovery, so that by 2000 the British breeding population was put at between 183 and 206 pairs, an estimate which had increased to between 363 and 429 pairs by 2005. The wintering population has also increased since the 1981-84 Winter Atlas estimated there were only ten individuals wintering in Britain. Bird Atlas 2007-2011 recorded an increase of 529% in the winter distribution since 1981-84.
In Wiltshire there were a few scattered records in the 19th century but the first 20th century record did not occur until a single bird was seen at Longleat in May 1957. There were then six records between 1960 and 1979, a further eight during the 1980s and 37 during the 1990s. Between 2001 and 2017 there were 186 records, mostly passage migrants though a few immature birds have been seen in summer. There have been no records of breeding in the county.
References
The following references are used throughout these species accounts, in the abbreviated form given in quotation marks:
“1968-72 Breeding Atlas” – Sharrack, J.T.R. 1976: The Atlas of Breeding Birds in Britain and Ireland. T. & A. Poyser
“1981-84 Winter Atlas” – Lack, P.C. 1986: The Atlas of Wintering Birds in Britain and Ireland. T. & A. Poyser
“1988-91 Breeding Atlas” – Gibbons, D.W., Reid, J.B. & Chapman, R.A. 1993: The New Atlas of Breeding Birds in Britain and Ireland 1988-91. T. & A. Poyser
“Birds of Wiltshire” – Ferguson-Lees, I.J. et al. 2007 : Birds of Wiltshire, published by the tetrad atlas group of the Wiltshire Ornithological Society after mapping fieldwork 1995-2000. Wiltshire Ornithological Society.
“Bird Atlas 2007-2011” – Balmer, D.E., Gillings, S., Caffrey, B.J., Swann, R.L., Downie, I.S. and Fuller, R.J. 2013: Bird Atlas 2007-2011: the Breeding and Wintering Birds of Britain and Ireland
“WTA2” – ("Wiltshire Tetrad Atlas 2 ") the present electronic publication, bringing together the Wiltshire data from “Birds of Wiltshire” and “Bird Atlas 2007-11”, together with data from further fieldwork carried out in 2011 and 2012.
"Hobby" - the annual bird report of the Wiltshire Ornithological Society.